|
|
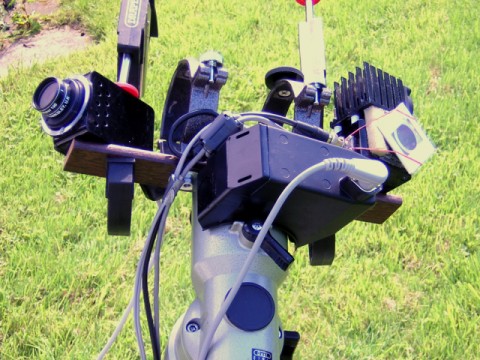
The Equipment On the left of the GPDX mount is the Vesta B+W SC3 "PIPCAM" modified webcam with a Star Analyser 100 grating mounted in front of the wide angle lens. A continuous series of 2 sec exposures was taken using K3CCDtools capture software On the right is the 1004x-JG used in video mode on this occasion, with the output recorded on a VCR. A 100 lines/mm grating (a prototype of the Star Analyser grating) was mounted in front of the camera standard wide angle lens. The cameras were equatorially mounted and driven and were aimed to cover different areas of the sky. The diffraction gratings were orientated approximately at 90 deg to the expected direction of the meteors. The chosen direction of the cameras was a compromise between being close enought to the radiant to increase the exposure due to the meteors moving slower relative to the camera, but far enough away that the range of angles would be limited, allowing the diffraction grating to disperse the light at a large enough angle from the meteor track. (PIPCAM aimed above Cassiopeia and 1004x at Ursa Major) | ||
|
|
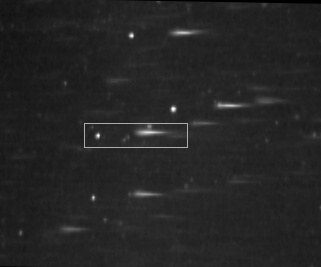
The Image Over a two hour period, approx 20 meteors were seen visually, but only one bright enough to record a spectrum was caught in the camera fields. The image is shown here and was taken by the SC3 webcam. Taken at 22:59 UT, it shows a bright (est magnitude -4) Perseid streaking away from Cassiopeia (centre left). The light from the meteor and the stars in the field is diffracted in a line to the right of the zero order image. Because the wide angle lens has such a short focal length (approx 5mm) the dispersion is very low (approximately 200A/pixel) This does have the advantage of giving a brighter spectrum however. Despite the low dispersion a number of emission lines can be seen in the meteor spectrum. | ||
|
|
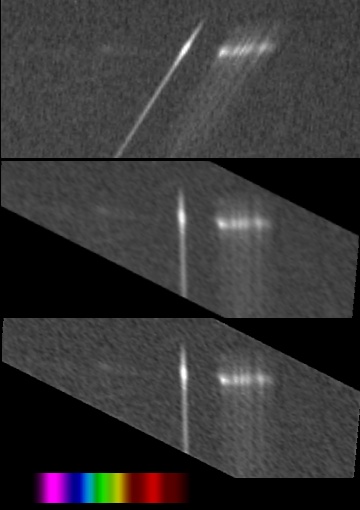
Processing The part of the image containg the meteor spectrum was isolated, magnified x2 and rotated slightly to make the spectrum horizontal. . . The slant in the spectrum caused by the direction of the metor not being perpendicular to the grating rulings was removed using the SLANT function in the IRIS image processing software. . . The slant removal process blurred the spectrum slightly so a slight unsharp mask was applied using Photoshop. . Visual Spec was used to produce this false colour spectrum, showing bright emission lines over the entire range of the camera sensitivity from violet to near IR | ||
|
|
Wavelength Calibration It was planned to use features in the spectra of stars in Cassiopeia to produce a value for the dispersion. Unfortunately this proved impossible, as at this resolution no features were visible in the star spectra. | ||
|
|
Instead, a graph of the continuum spectrum of Gamma Cas was compared with a similar but calibrated graph produced earlier with the same camera but at a much higher dispersion. This gave an estimate of the dispersion of 200A/pixel. A check was also made for potential variations in image scale between the region around Cassiopeia and the meteor trail due to the non flat field of the wide angle lens. The scale was found to be the same within 1% however so no correction was made. | ||
|
|
The Result This graph shows the resulting spectrum, taken at the brightest point on the track and plotted using Visual Spec. It should be noted that the error in the values for lines as given by Vspec is likely to to be of the order of +-5%, given the low dispersion and calibration issues. Subsequently, a check of the dispersion of this setup was made using a distant LP sodium streetlamp. This confirmed that the original calibration was correct within +-1% | ||
|
Observed line (A) |
Tentative identification |
Error (%) |
Identification of Lines The identification of the elements producing the lines in the spectrum is problematic given the low dispersion. By refering to other published meteor spectra, a tentative identification has been proposed for the lines observed |
|
3957 |
Ca II 3934, 3968 |
+0.2 | |
|
5147 |
Mg I 5167, 5173, 5184 |
-0.5 | |
|
5834 |
Na I 5890, 5896 |
-1.0 | |
|
6357 |
Si II 6347, 6371 |
0 | |
|
7695 |
OI 7774 |
-1.0 | |
|
8456 |
OI 8446 |
+0.1 | |
|
|
Development of spectrum along track This animation shows the change in the spectrum along the length of the meteor trail. Note that initially only a single line (thought to be the OI 3F forbidden line in the green at 5577A) is visible. This is replaced by other lines as the meteor flares in the lower atmosphere. | ||