Feasibility of detecting Be star outbursts using
Star Analyser grating (1)
Be Star QR
Vul in outburst
Sept
2008
An outburst of the Be Star QR Vul was
recently reported http://arasbeam.free.fr/spip.php?article12&lang=en
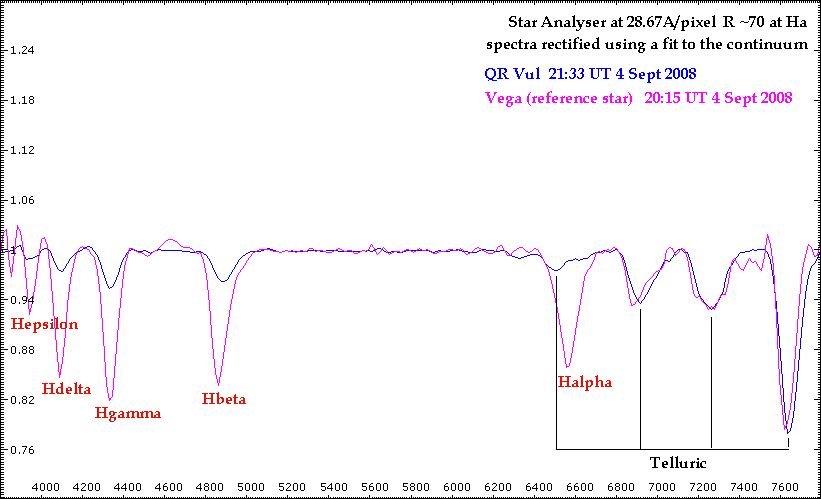
A spectrum of QR Vul was recorded using a Star Analyser on 4th Sept 2008. Dispersion was 28.67A/pixel which is low even for the Star Analyser. (It was set up at the time with a smaller than normal distance to the CCD to record a faint mag 14 Nova.)
The spectrum was reduced as normal and then normalised to a fit to the continuum to make any emission/absorption lines more clear. The same was done with a spectrum of Vega as a comparison.
Some Balmer absorption lines are evident in the in
QR Vul spectrum (H beta and below) but the H
alpha wavelength does not
show any obvious
evidence of
emission or absorption.

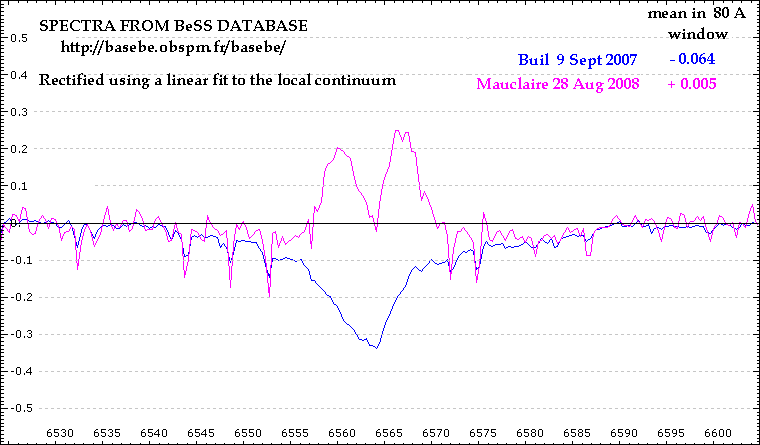
To estimate what should be seen in a low resolution
spectrum, I looked in the BeSS
database
for high resolution spectra of the H alpha region
from before
and after the outburst (Buil Sept 07 and
Mauclaire
Aug 08). I
normalised them to the continuum and
measured the average level relative to the
continuum in an
80A window
(approximately the same resolution as the Star
Analyser spectra)

The pre outburst average level was -0.064, an
absorption region which would have easily
been detected in a low
resolution spectrum taken
using the
Star Analyser.
The post outburst average level was only +0.005. ie
essentially flat in an 80A window. This is because the
very wide absorption
wings cancel
out the emission region
in an 80A window. This explains
the lack of
absorption or
emission
seen at the H alpha wqvelength in the post outburst Star
Analyser spectrum.
The conclusion is that the QR Vul outburst could have been
detected using the Star Analyser.
This could provide an efficient way to
survey many Be Stars to fainter magnitudes than is
possible at higher
resolution,
looking for large
changes.