There are several hundred Be stars in the ARAS Beam
database between mag 9 and
12 (the estimated lower limit for
obtaining high
S/N spectra with the
Star Analyser at Three Hills Observatory).
Most have
either no data or only old data from over 5
years
ago. This could
prove a fertile area for amateurs
interested in checking the current status of
these
stars.
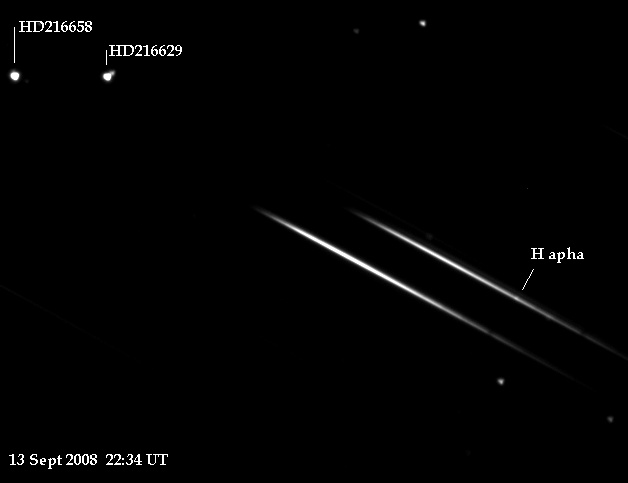
The latest
spectrum of HD216629 in the ARAS Beam database is
dated1997 so an update is overdue. At Mag 9.3 however it
is outside the range of
most amateur
medium resulution
spectrographs. A low resolution
spectrum can
easily be obtained however
using the Star Analyser
grating. While not
showing the detailed line profile, it
should be possible to make
an estimate of the
strength
of any emission line to flag any
needing
follow up measurements.
The Star Analyser spectrum was
reduced in the usual way and finally normalised
using
a fit to the
continuum so that
the lines strengths
relative to the continuum could
be
compared. Spectra
taken from
the OHP ELODIE database from
1994-1997 are
shown normalised in the same way for
comparison.
(Note,
the ELODIE spectra are at
much higher resolution than the Star
Analyser
(~40000 compared with ~100)
A Gaussian filter was applied to the
ELODIE results
to simulate the Star Analyser
resolution.
There is
good
agreement between the
features
in the current spectrum taken with the Star
Analyser
and those taken 1994-1997 using
ELODIE. In
particular, the H
alpha emission line is
of similar strength with a perhaps 20% weakening
curently
compared with the earlier
spectra, though this may be within the error
of the
technique. (The slight fine scale ripple in the
Star
Analyser spectrum is
though to have been produced by
the algorithm used to rotate the image prior to
extracting
the spectral
data)
For completeness here is a high
resolution plot of the H alpha region from the 1997
spectrum in the ELODIE
Archive