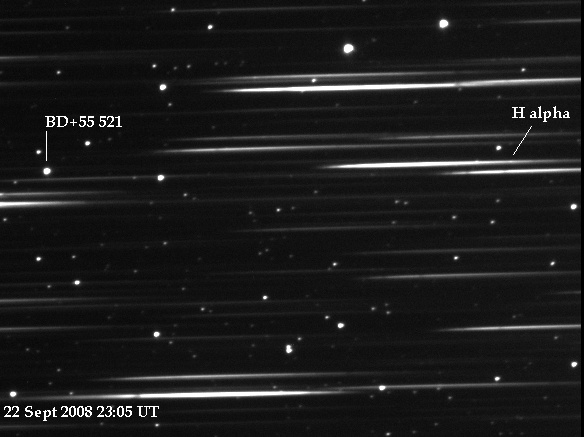
The only spectra of BD +55 521 currently in the ARAS BeAm database date from January
2003, so an update is overdue. Two low
resolution spectra were
measured on 20th and
22nd
September 2008 using the Star Analyser grating.
While
not showing the detailed line profile, it should be
possible to
estimate if the strength
of the H
alpha emission line has
changed
significantly.
The Star Analyser spectra were
reduced in the usual way and finally normalised
using
a fit to the
continuum. The 2003 spectrum from
the OHP ELODIE database was
normalised in the same
way and
Gausian filtered to match the Star Analyser
resolution for comparison.
At high
resolution, the
2003 ELODIE spectrum
shows emission features in the H
alpha line (see below). When
filtered to
simulate the
resolution of the Star Analyser spectrum
however,
the net effect is of a slight overal absorption
centred at
the H alpha
wavelength. By contrast, the
two Star Analyser spectra recorded in
September 2008 show
a distinct
emission feature at this position. This suggests
that
there may have been a significant increase in the
strength
of H alpha
emission in this star since 2003. A
higher resolution spectra would be required
to investigate
the detailed nature
of the change but the star is too faint to
measure this
using the Three
Hills Observatory LHIRES III
spectrograph.
A high resolution plot of
the H alpha region from the 2003 spectrum in the
ELODIE Archive