The only spectra of V831 Cas currently in the ARAS BeAm database dates from
December 1996, so an update is overdue. Three
low resolution
spectra were
measured on
20th,22nd and 24th September 2008 using
the
Star Analyser
grating. While not
showing the detailed line profile, it should be
possible to estimate if the strength
of the H
alpha emission
line has changed
significantly.
The Star Analyser spectra were
reduced in the usual way and finally normalised using
a fit to the
continuum. The 1996 spectrum from
the OHP ELODIE database was
normalised in the same
way and
gaussian filtered to match the Star Analyser
resolution for comparison.
The 1996
filtered ELODIE spectrum
suggests that the
H alpha
emission should be clearly visible, peaking at
about
12% above the continuum in a Star Analyser
spectrum
provided a
sufficiently low signal/noise ratio
could be achieved.
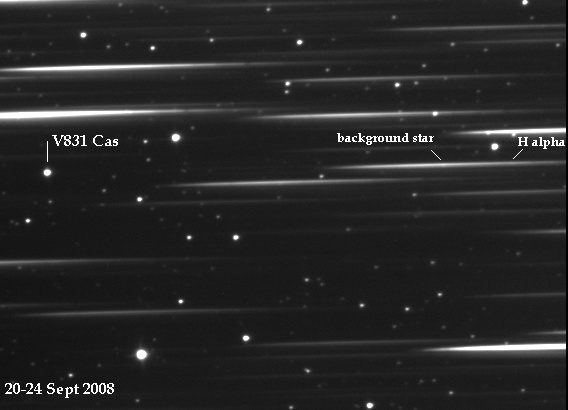
Three spectra
of successively
increasing total
exposure were taken on different nights.
The spectrum on 24th September taken under
improved sky conditions
clearly
shows the H alpha emission
peaking approximately 7% above
the continuum.
The measured
level is lower than that measured in 1996 but the
difference
may not be statistically significant.
A high resolution plot of
the H alpha region from the 1996 spectrum in the
ELODIE Archive