SPECTROSCOPY
T Tauri star
campaign 2012-2013
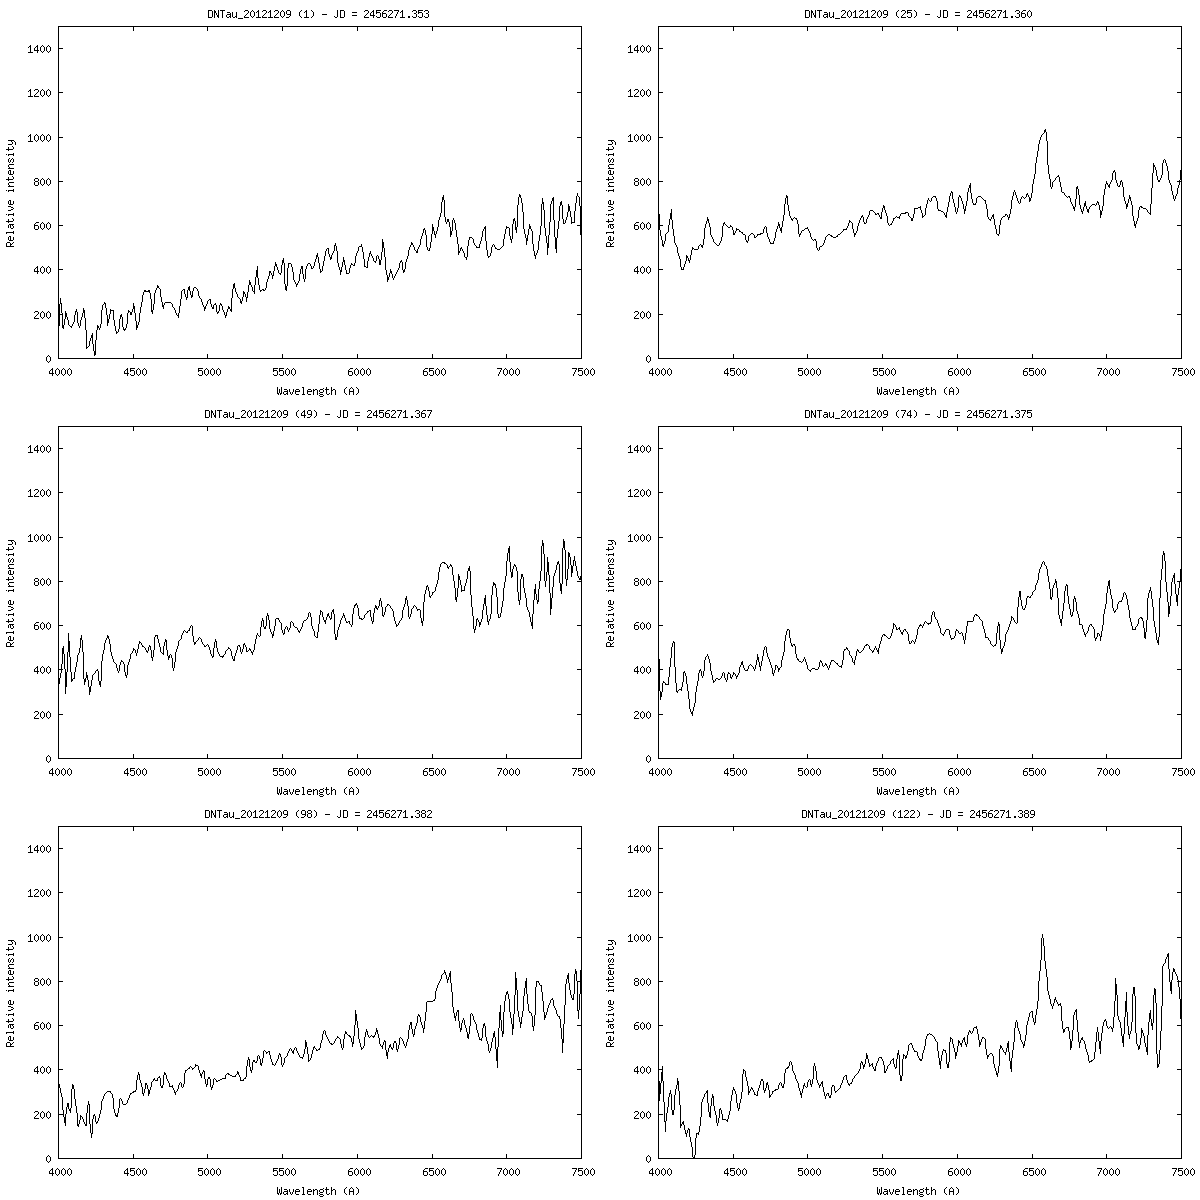
A remarkable large, fast transient in the spectrum of DN Tau 2012-12-09
(For further analysis see also the presentation "Pushing the limits using commerical spectrographs" at the joint BAA/AAVSO variable star meeting July 2018)

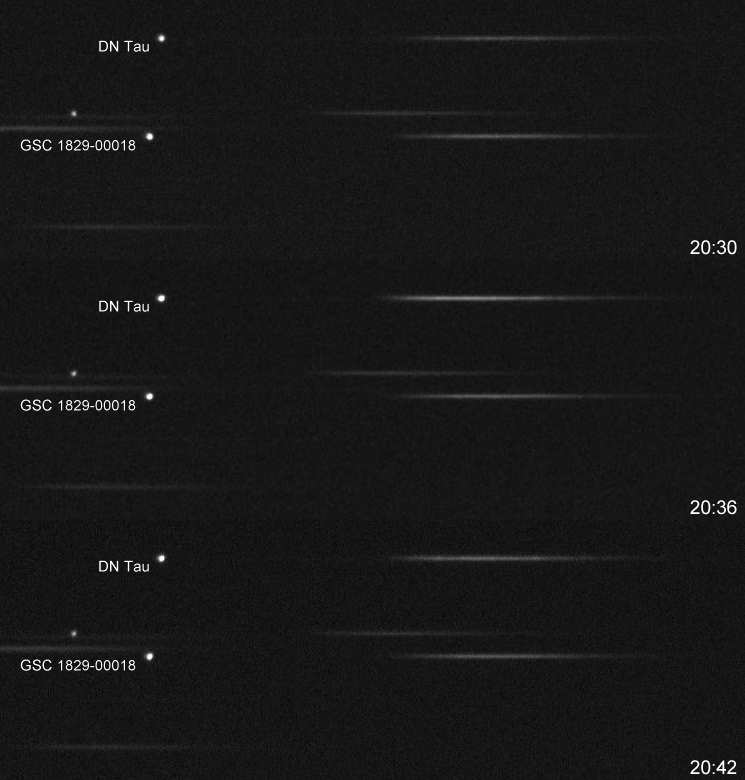
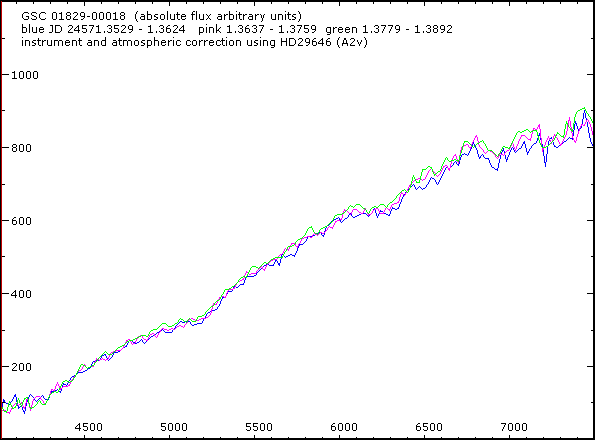
Three consecutive Star Analyser spectra of DN Tau (each an average of 30 x 20 second exposures) taken on 9th December 2012 between 20:28 and 21:22 UT show significant changes in the shape of the continuum. Note the lack of variation in the comparison star GSC 01829-00018 in the same field. See here for a description of the measurement and data reduction procedures
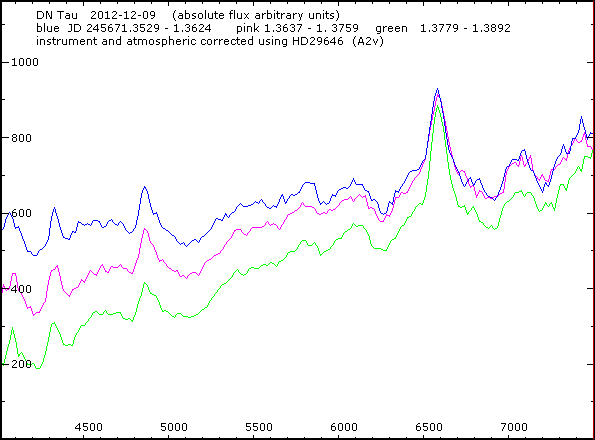
Although noisy, the 88 individual 20 second exposure spectra clearly track a rapid rise in flux over just 6 minutes, most pronounced at the blue end where at 4500A the flux increases by ~300%
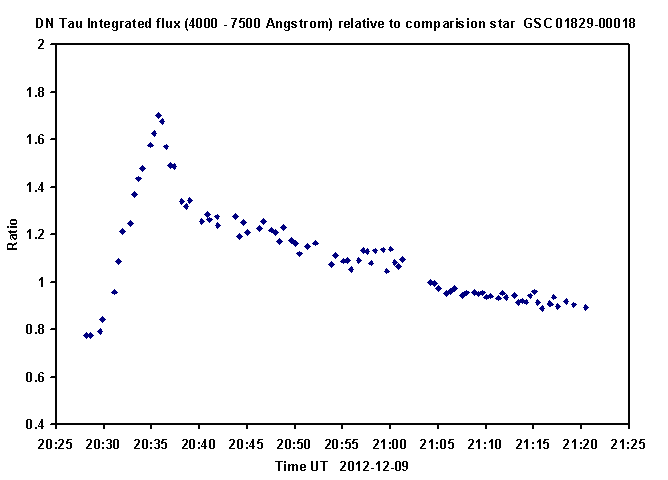
A plot of the integrated flux over the wavelength range 4000-7500A shows a rapid increase in total flux of ~130% over 6 minutes followed by a rapid partial recovery over the next 6 minutes, slowing and reaching a level ~20% above the initial level after a further 40 minutes
